On a vanilla OpenWRT install, it seems to put them in individual RRD folders, e.g. /foo/rrd/hostname/interface-eth0, /interface-eth1, etc.
On Omnia, they all seem to be in separate RRDs under the same generic “interface” folder. I think that might have something to do with it, but I don’t know where that’s configured.
In addition, the conntrack graph is broken completely, despite the conntrack.rrd file being updated:
My collectd-mod-ping graph is also broken. First graph is broken, second was showing NaN for everything and an strace showed it not actually pinging anything, but after waiting a couple hours it began working.
For Interfaces graphs - I switched to Netlink plugin - it seems to produce the same charts (+ some others) and the interface names are properly displayed on the charts.
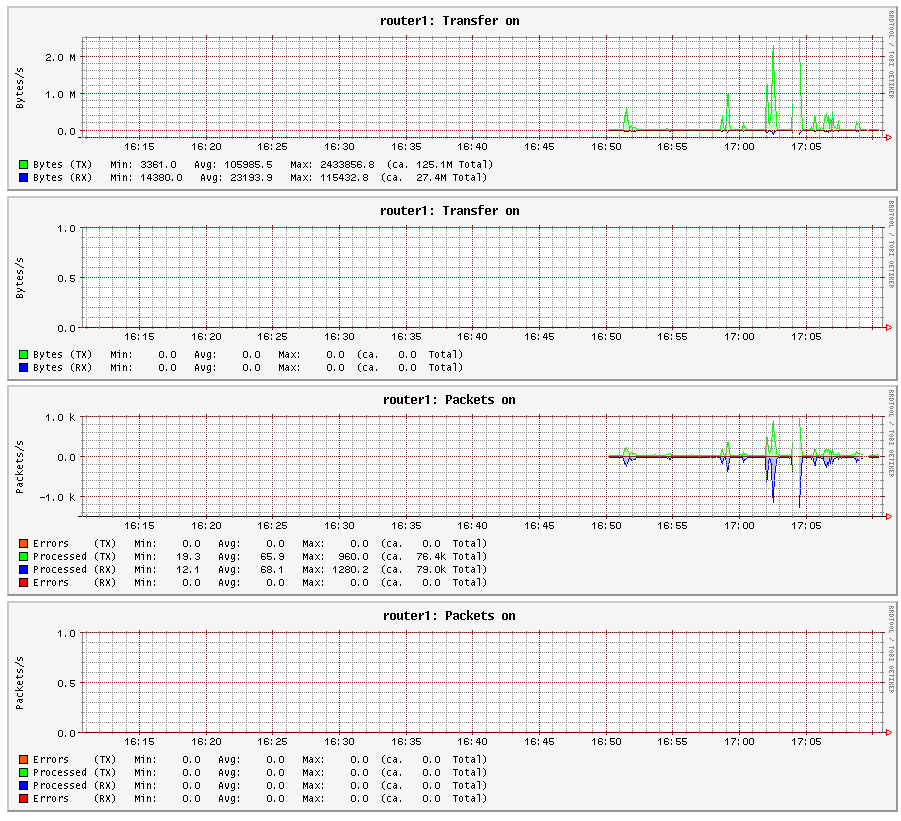
One question about collectd traffic counters - is it correct that RX bytes or packets are recorded as negative values? You can see the 3rd chart in original @mattventura post. I would expect received packets / bytes to be also positive numbers …
I found that any space (trailing,leading) might cause the ping module to not collect data. (or generally null option might break your graphs). In my case i installed dns, openvpn, ping plugins …all fine. Later i put protocols, thermal, ntpdate on …and ping, dns, wifinfo shown no data … i removed ntpdate and magically all went back again.
no_labels_for_ifaces_issue: i have since i recieved my TO.